Sunburst Chart
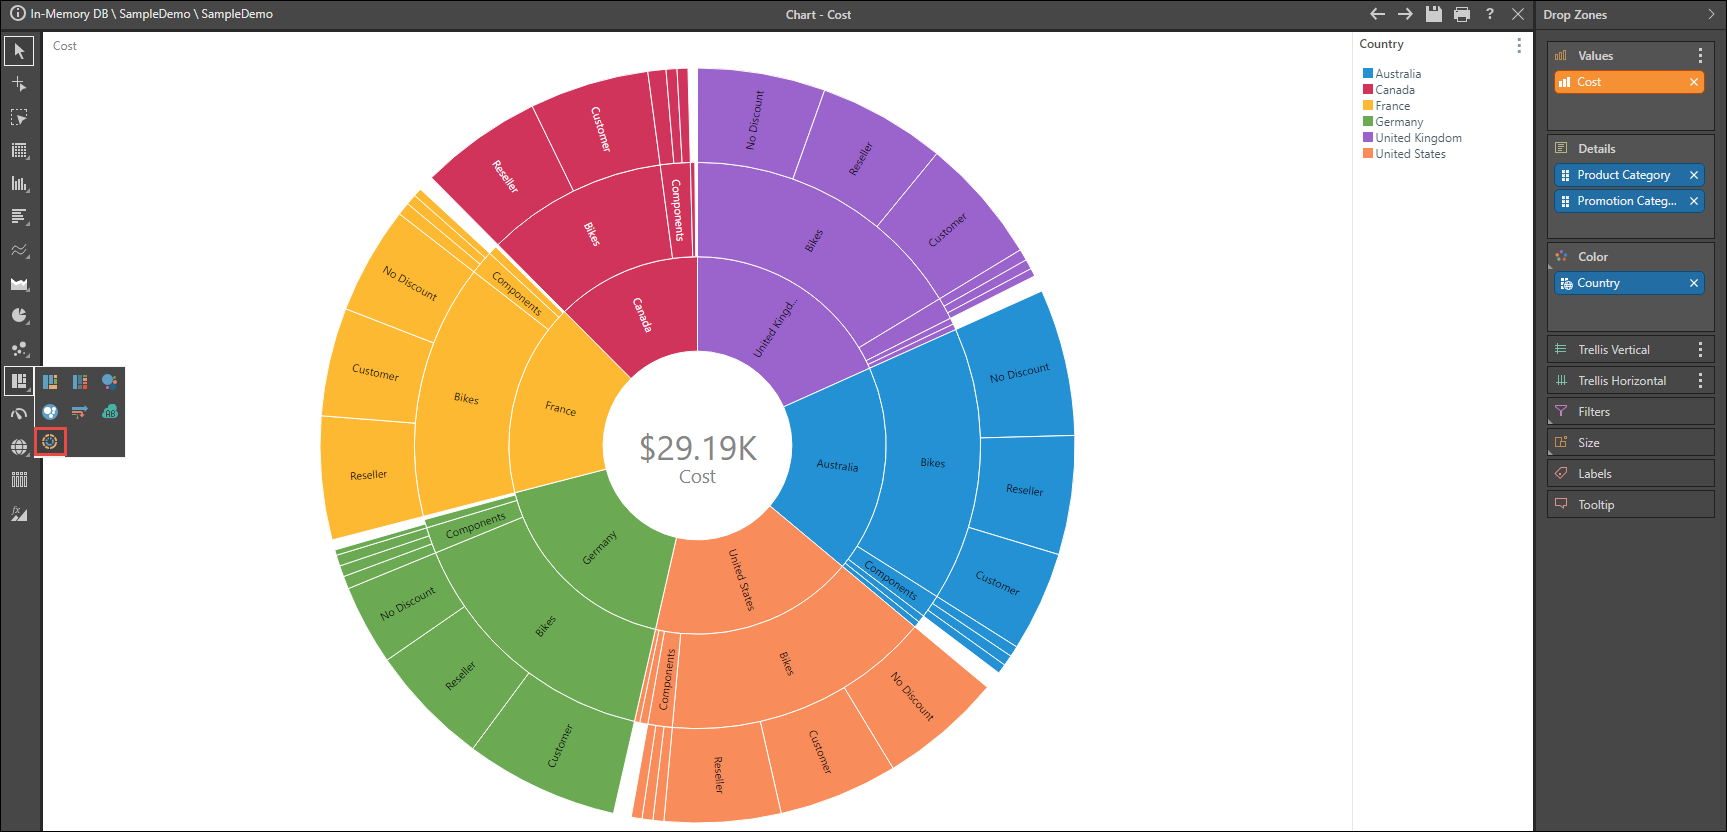
Sunburst charts are generally used to display hierarchical data, with each ring representing a level of the hierarchy. The sunburst contains a circle displaying the total value; the innermost ring represents the first hierarchy, or hierarchy level, and the outermost ring represents the last hierarchy or level. Each ring is divided into segments representing the member elements in that hierarchy; segment size is driven by value. Each segment is colored according to the first hierarchy (inner ring) to which it belongs).
Build a Sunburst Chart
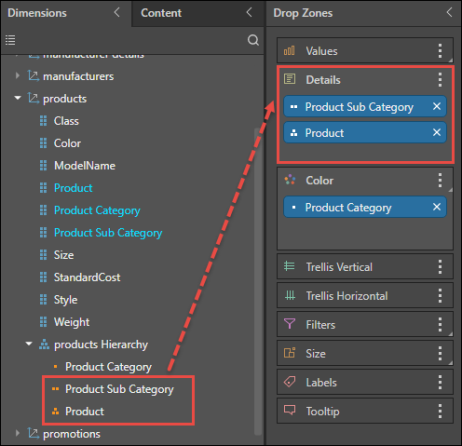
To build a sunburst chart, add a measure to Values, and add 1 hierarchy to the Color drop zone. This hierarchy will appear as the visual's innermost ring. Add the rest of the relevant hierarchies to the Details drop zone, in the order in which they should appear in the chart.
Examples
Open the Sample Demo model in Discover to follow the examples below.
Example 1
Step 1
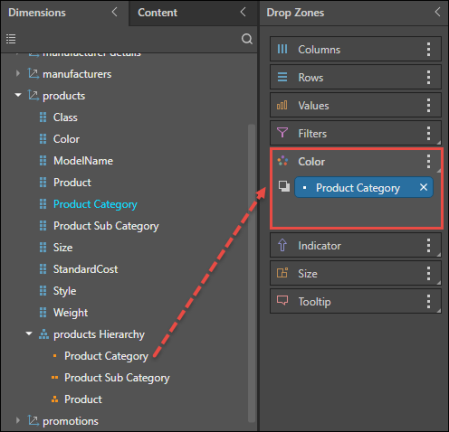
Open the Products Dimension, and then open the Products Hierarchy; add the Product Category level to the Color drop zone.
Step 2
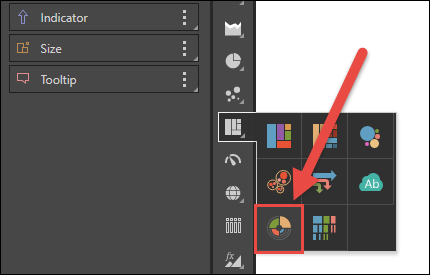
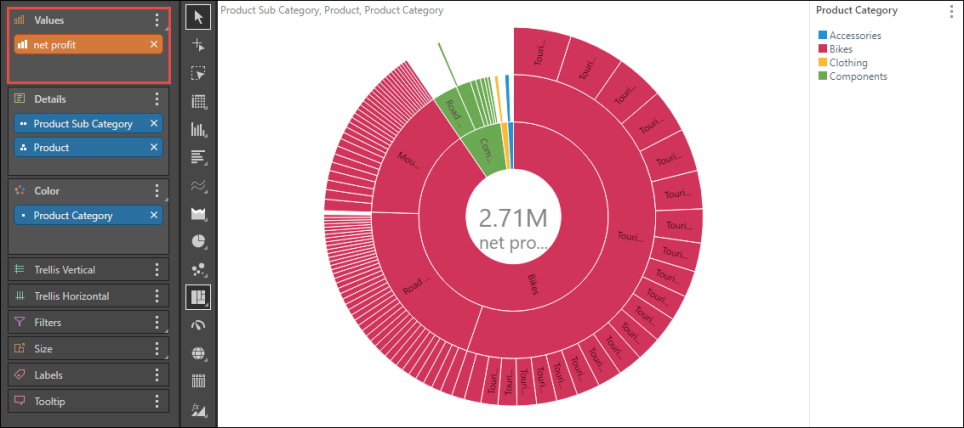
Select Sunburst chart from the visualization menu.
Step 3
From the Products Hierarchy, add the Product Sub Category and Product levels to the Details drop zone.
Step 4
Add the Net Profit measure to the Values zone. You will now have a basic sunburst chart showing profit by each level of the product hierarchy.
Example 2
Step 1
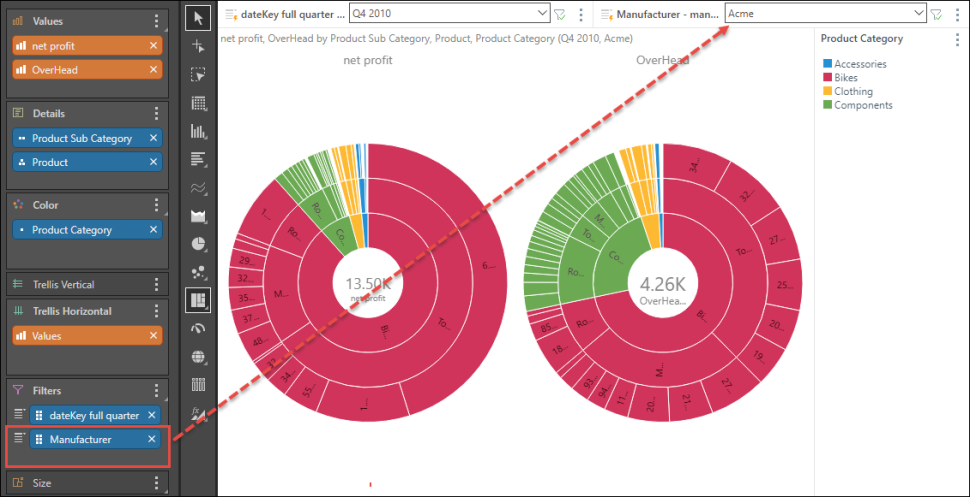
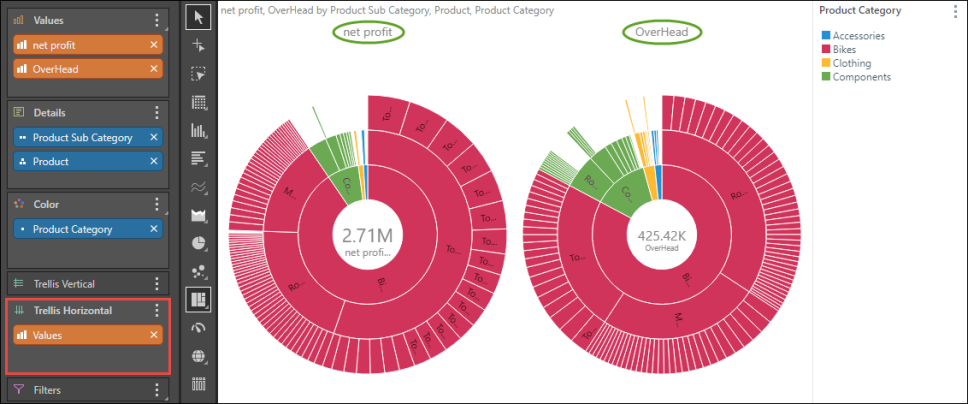
Add the Overhead measure to the Trellis Horizontal zone to compare net profit with overhead across 2 charts.
Step 2
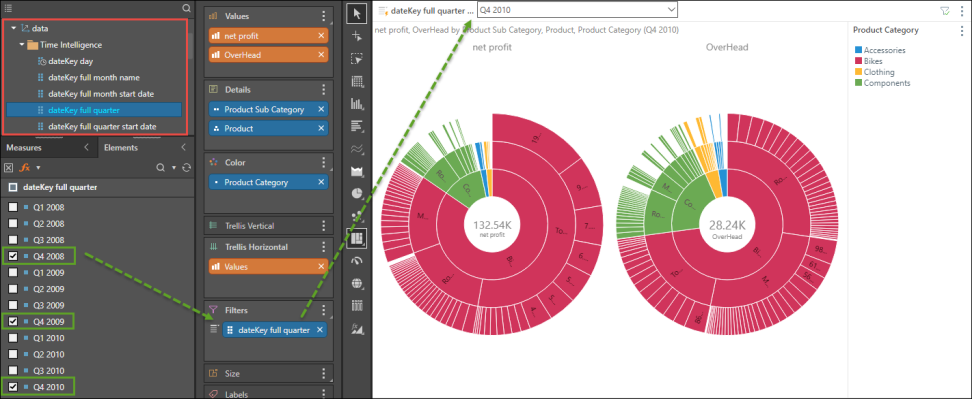
Open the Data dimension, and then open the Time Intelligence folder; right click on dateKey full quarter to open its elements tree. Select Q4 2008, Q4 2009, and Q4 2010 and ensure the resulting blue chip is placed in the Filters zone. Use the slicer produced to filter the query by quarter and year.
Step 3
Add the manufacturer hierarchy to the Filters zone to filter the query by manufacturer.